Using Python and AI to predict types of wine
I’ve been working with AI/Machine Learning at Jusbrasil recently, and it’s being pretty challenging due to the huge amount of data that we have to deal with, so cleaning this data and making predictions and classifications in an acceptable time demands a nice AI architecture.
That said I can say that I’m extremely thankful for a few technologies that are helping me go through this challenge (and the pain of cleaning this amount of data): Python, Scikit Learn, Pandas, and the whole stack that the Scikit Learn use, such as NumPy, SciPy, matplotlib and few others.
So, this inspired me to spread the word, so I’ll be showing here a simple example of Machine Learning using Python, Pandas and Scikit Learn to predict, given a great amount of data/features about wines, if a wine is white or red.
disclaimer: I’m assuming that you already have a small knowledge on the ideas of the machine learning and its mathematical aspects (although not necessary to implement the code that I’ll show here), this is just a simple introduction to scikit learn and its power, so the example is pretty simple and straight forward, if you just want the code, here it is: github link
What’s Pandas?
Pandas is an amazing library for data manipulation, it makes the process of dealing with data very easy and straight forward, we can work with CSV, JSON and plenty other formats without struggling to manipulate the data, give it five minutes and skim their docs, it will definitely worth it!
Fetching the data
Let’s start fetching the data with Pandas, (you can download the data here) to do so, just import Pandas and read the CSV file, just like that:
We can see how the data is structured by doing a few commands:
As output, we have the first 5 rows of the red wine’s data
Or we just use a function from Pandas that describe very well our data
Understanding our data
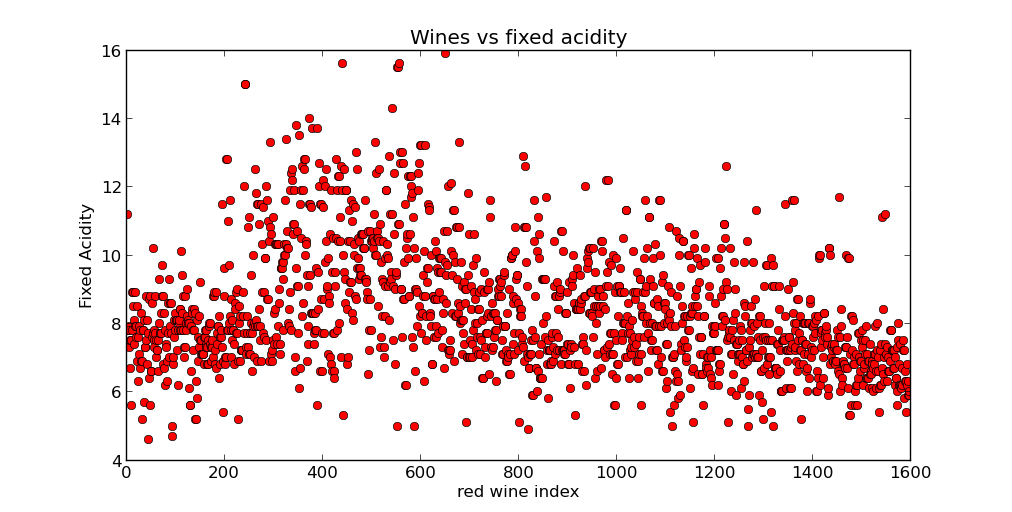
Matplotlib gives you many ways to plot our data into graphs so we can understand what is going on with the data so we can choose the best model/algorithm for the given scenario,
For instance, let’s take a look at the relation between the red wines and its fixed acidity
Preparing the Data for classification
Now we’re going to add a new feature/variable to our data, which is our target variable, the Y, that will be telling if the wine from our dataset is white or red
We need to get all of our feature into a vector called X, that will be set into our algorithm, right? And, we need to get all our targets (white or red) and set into a Y variable
Notice that we’re merging both datasets together, the one with the red wines and the one with the white wines, so we can send them together to the algorithm. Now we’re going to binarize the labels ‘white’ and ‘red’, so the mathematical model can use it. It’s pretty simple
The algorithm
Now that we have our data well structured and we do understand it, we can start looking for an algorithm to use. A good algorithm for our scenario is a simple Logistic Regression, that will return a model that we’ll use to make our predictions/classification. The mathematical linear model that will use is the following:
$$
f(w) := \lambda, R(w) + \frac1n \sum_{i=1}^n L(w;x_i,y_i) \label{eq:regPrimal}
$$
In addition with the loss function defined by the logistic loss
$$ L(w;x,y) := \log(1+\exp( -y w^T x )) $$
The Scikit learn provides an awesome library with an amazingly ease of use, so that we don’t have to implement the whole model from scratch. All we have to do is create a object from the model we want to use, understand how it works (at least understand how to use its interface to do what we want). In this case, we will be using the cross validation object, which is another discussion for another time, but in a few words, it will divide our dataset and test it against all parts of the divided dataset, this way we make sure that we’re validating the quality of the result.
And as the result we get:
And that’s the exactly the precision of the algorithm over the given dataset, 98% of precision, which is quite good! Now, for example, we can save this trained classifier and use it for future classifications of incoming data about wines that need to be classified as white or red, to do so, we just call the method clf.predict(X) where this X will be the new wine’s data. simplicity at its best!